I’ve joked to my friends that if there is anything that proves how important I consider the clean energy topic to be, it’s me digging into electricity pricing. I have a natural aversion to economics – I’ve demoted that aversion somewhat from the position of idealist elitism it carried back when I was a teenager (anything to do with money was about greed and not worth considering). Now I acknowledge that my prejudice toward economics is a flaw in my character which means I’m probably missing a whole lot about a fascinating and complex aspect of societal dynamics. I’ve battled that weakness a couple of times to catch a glimpse of that complexity.
So, when I used to hear people complain about nuclear energy being expensive and slow to build, I would thoughtfully nod my head, thinking: “Well, they probably have a point, it’s expensive, and it’s quite a project to build a plant. Still, it’s important because it can provide astounding amounts of reliable carbon-free energy, so we just have to stomach that slow and costly process.”
You’d think I would have learned by now about the risks of making assumptions based on hearsay?
When someone pointed me to a graph comparing the best build-rates we’ve ever had on carbon-free energy over the last half a century (first the excellent one presented by Climate Gamble, then another from Cao J et al, Science, which you see below), I had to stare at it for a while to process how wrong I had been about that “slow to build” part.

Considering one huge plant takes years (and with delays, sometimes more than a decade) to build, it seems slow. But that’s mostly because we don’t really have a useful everyday intuition about how frigging massive amounts of energy nuclear plants produce once they are online, and then keep on producing, for over half a century.

The biggest dam in the world equals two Bruce nuclear power plants in Canada.
The only thing that can surpass a big nuclear plant in energy output is a hydropower dam of epic proportions – like the record-breaking Itaipu dam on the border of Brazil and Paraguay, which produces almost 20% worth of Brazil’s entire electricity needs. The biggest dams in the world (Itaipu and Three Gorges) produce only twice as much electricity each as the existing largest nuclear power plant in Canada generates alone.
I hope these visuals (above and below) help drive home the point that nuclear power plants provide a massive constant flow of energy.

Our World In Data: Scale for Electricity. For better detail on renewables (here the small print in lower right) see the the original chart with the additional magnified scale.
So… if I was wrong about that one, what about the economics arguments?
I have said many times that an evidence-based, actual commitment to climate solutions, using all IPCC recommended technologies – including nuclear power – is the top priority issue in the world today. I’ve already dug into questions about nuclear waste, safety, and the expert views on climate mitigation power. I can’t afford not to at least try to understand the economics better, too.
What do the actual numbers tell us?
Like so many times before, when I’ve actually started looking at a topic, the dishonesty of many of the very loud and self-convinced arguments is astounding. I began to delve into this in my recent piece The Right Price For Saving the Planet Depends on the Energy Form. I highlighted some of the inconsistencies in the economic arguments against nuclear, but I didn’t actually wade into the numbers (there’s that natural aversion again). Serendipitously, however, I was pointed to an excellent blog post by Jani-Petri Martikainen, a physicist and a fellow Finnish Ecomodernist. He had done just that: perfectly illustrated the points I had made in my first piece, but with actual numbers of capital per energy produced. I was thrilled, and asked him if I could translate his table into English. He made the devilishly reasonable suggestion that I should update the 5-year-old table with newer data.
Figuring out strange things like what was the meaning of energy per time divided by time divided by time yet again, or what were the differences between four differently named energy capacities for power plants, it took me a few days and many deep breaths to do that. Finally, here is an updated version of that original table, looking at a common point of complaint in many economic arguments against nuclear power: that it ‘costs so much to build’.
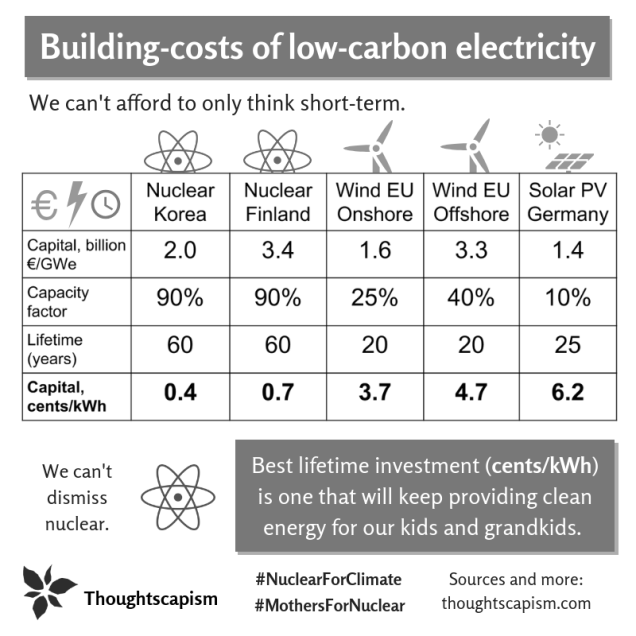
Updated table of the values presented in Jani-Petri Martikainen’s original table in Finnish. For sources and calculations, see appendix in the end of the piece. Values updated in 2018.
That argument holds water only if we are merely interested in results in the short term. But what, exactly, is short-term about mitigating climate change and having clean air to breathe? We need to clean up fast, and we need to do it for the long-term.
Despite lack of subsidies, and excessive regulatory hurdles, or even purely miserable planning leading to unnecessary delays and growing costs in the construction phase, even when nuclear power plant becomes as ‘scandalously expensive’ as the reactor currently in construction in Finland – even then, the cost divided on the total energy output remains low in comparison to other clean energy forms. As soon as Olkiluoto 3 (which the ‘Nuclear Finland’ column in the table refers to) will come online – in about a year and a half – it will provide 10% of Finland’s electricity, and is expected to decrease the price of electricity in all the Nordic countries, as long as other nuclear plants are not shut down.
South Korea on the other hand is an example of a country where the construction costs of nuclear have stayed consistently low. They produce 30% of their electricity with nuclear power, and are in the process of building two more plants.
Even more complicated analyses of economics
There are many other things to take into consideration in the question of energy economics, of course. There are very long and in-depth discussions on that for nuclear power for those who would like to dive in to that. I would like to give an idea about some of the major factors at play, and once more lift up some of Jani-Petri’s excellent points.
Jani-Petri spends quite some time delving into the use of what is called a discount rate: a tool for appraising construction project investments vs their returns in the future. He notes some strange tendencies in the way the authors of chapter seven of the Intergovernmental Panel on Climate Change (IPCC) Working Group III -report try to hide proper comparison of the costs of energy forms in their supplementary materials, perceivably for no other reason than because of the discomfort of letting their readers know that nuclear power is almost always the lowest cost energy solution, and always the lowest cost zero carbon energy solution.
For more detail, you can find an in-depth account of the numbers from the annex III of the WGIII report in his article on Discounting and costs (Part 2) IPCC WGIII report on mitigation. Note, these are comparisons of Levelised Costs Of Energy (LCOE), not simply construction costs – more on LCOE’s below. Shortly:
nuclear power is the lowest cost zero carbon source of electricity no matter what discount rate was used.
This is his table based on IPCC’s numbers. Nuclear is set as the baseline, the figures in green=more expensive than nuclear, the red=cheaper.

Derived from the IPCC numbers, setting nuclear costs as baseline. Green=more expensive than nuclear, red=cheaper. A lower discount rate means that we value long-term results of investments more. Table and analysis by Jani-Petri Martikainen: Discounting and costs (Part 2) IPCC WGIII report on mitigation.
But there are other kind of aspects to the question of economics of electricity apart from investment costs. What if we turn the question around, not how much it costs to produce x amount of energy, but what value does the electricity have for the consumer, whether it be a family or a hospital.
Availability of energy has value
How much would you be prepared to pay for electricity that was always available in the morning, when you were fixing breakfast to your family, then again in the evening, when it was time for dinner, and stayed on until you went to bed? What about the same amount of electricity, but available only during the daylight ours? Or perhaps only in the evening, and not in the morning, or vice versa – and you could only have an approximate idea about which way it would be, a day or a two in advance?
The ability to put electricity generation potential to use is called capacity utilization. Variability in an energy source inherently lowers the degree of that utilization. In another blog post, Jani-Petri draws interesting parallels from a point of history when coal power won out against hydro, not because of price, but particularly because of its high availability. On the prospects of moving from that constancy to a more variable power scenario, he asks:
Who bears the cost of lower utilization? Labour? Lower salaries and/or more irregular working hours anyone? Vacations in the winter since solar power produces mainly in the summer?
The value of electricity to private as well as corporate consumers of electricity has a lot to do with the reliability of it being there when they need it. Considering that the capacity of storing electricity is low (in the manner of minutes rather than hours on a national scale), there are natural complications to electricity production that will vary with weather and time of year. Where it can flexibly be applied, it is very welcome, but that type of energy reaching a majority share of the market is challenging, to say the least. All this also plays a role to the actual value of electricity to the consumer. Some services, say things like hospitals, schools, trains, and cold storage facilities, really need a reliable, constant flow of power, a ‘base load’ kind of electricity. The cost of outages tends to be very greatly larger than the price of the electricity itself that was lost.
It is clear that being constantly available increases the value of electricity. Constant power enables things we simply could not achieve with intermittent supply. It is not a simple task to assign numbers to this, but it is also not something we can ignore.
What about all the auxiliary costs?
Of course there are also a number of different specific costs we could discuss: operational and maintenance costs (for nuclear, often comparable or smaller than coal), costs for expanding the electrical grid (considerable cost for renewables, not included in their price), and costs for energy storage (another big cost and largest limiting factor for renewables).
Take the fresh news about the world’s largest battery, installed in Australia to help buffer wind farms: the quick back of the envelope calculations by Robert Hargraves (Ass. Prof. in Math and founder of a thorium molten salt-nuclear energy company) puts the battery’s estimated added costs for electricity at almost 40 cents/kWh. I am happy to update the piece with a better estimate, if I find one – but for context, even a tenth of that price would still double the price for energy per capital investment (which, as seen in the table before, for European wind is around 4 cents/kWh, vs 1 cent/kWh or less for nuclear).
Even this largest battery in the world only adds about 20 seconds worth of buffering capacity for the total electricity consumption of Australia (calculated from the 2014 total) – or about a few hours worth for 30,000 households. It enables a supply during the short transition time it takes to power up the back-up fossil fuel sources – it’s not a solution for reliable long term electricity supply.
There are also costs for handling waste. Renewable companies are largely not obliged to take care of their hazardous waste, but costs of waste collection and handling are included in the responsibilities of the nuclear industry. Even so, looking at the total cost from mining, processing, and handling of waste, the Word Nuclear Association (WNA) estimates nuclear power’s total costs from fuel to be considerably smaller than that of coal and gas’ plants, thanks to the vastly concentrated energy contained in uranium (easier transport and storage with such small volumes):
the total fuel costs of a nuclear power plant in the OECD are typically about one-third to one-half of those for a coal-fired plant and between one-quarter and one-fifth of those for a gas combined-cycle plant.
The total costs for decommissioning a nuclear plant are also only a fraction of its price per energy produced – estimated at about 0.1-0.2 cents/kWh. No doubling or ten-times factors to the prices there.
The WNA present OECD estimates on the levelised costs of energy (LCOE) as well as their system costs for four different countries (see below). Nuclear is the cheapest option in all but one: the US – where its ‘only’ the third cheapest, and still cheaper than offshore wind and Solar PV. This trend isn’t surprising, considering that nuclear costs in the US have risen to a class of their own through a few decades of increasing regulatory burdens. Despite all that, it’s still almost as cheap as the cheapest low-carbon energy form (onshore wind). You can more about that in my earlier piece, or in the paper from 2016, analysed by its authors here.

WNA caption: LCOE plant costs have been taken from Projected Costs of Generating Electricity 2015 Edition. System costs have been taken fromNuclear Energy and Renewables (NEA, 2012). A 30% generation penetration level for onshore wind, offshore wind and solar PV has been assumed in the NEA estimates of system costs, which include back-up costs, balancing costs, grid connection, extension and reinforcement costs. A discount rate of 7% is used throughout, which is therefore consistent with the plant level LCOE estimates given in the 2015 edition of Projected Costs of Generating Electricity. The 2015 study applies a $30/t CO2 price on fossil fuel use and uses 2013 US$ values and exchange rates.
The true costs of energy forms
The big complication through all the price comparisons, is that the myriad types of environmental and health costs of different energy forms are not consistently included in their overt price, but externalised to the society at large. Ultimately, projects like the EU ExternE are (while not above criticism, still) the ones we should look to in order to form a more comprehensive view on the best targets of investment for long-term energy solutions. As I wrote in my piece on Nuclear Waste: Ideas vs Reality,
If we are serious about protecting human health as well as that of the environment, we need to step above our gut reactions, our ‘we just know’ estimates on the problems of different energy forms, and we need start comparing all the external costs (all risks and health impacts) from each type of energy – estimates that take into account the impacts from mining, operating, and waste.

An EU-funded project Ecofys, also presented in the book Climate Gamble, and in the nuclear safety article by Janne Korhonen, has analysed external impacts of energy forms. Note, accidents for nuclear are included (but I am not sure about hydro accidents).
Hydro power has its own drawbacks, like a few spectacular accidents (largest being the 1975 Banqiao dam failure that cost 170,000 lives), and flooding large areas, nevertheless, it is a great clean source of energy – but we don’t have enough waterways left to harness in order to replace fossil fuels. Wind is intermittent, but it can be a great help up to a point – IPCC does not see a realistic scenario for more than 30% of the world’s energy share for all renewables taken together, by 2050.
Nuclear power has the advantage of being a long-term solution that can be expanded fast. It provides us with massive amounts of clean energy for a low cost to the consumer, the environment, and the society at large.
![]()
For more of my articles on climate and energy, look here. Even better idea, however, is to read the short, evidence-dense book Climate Gamble or browse the graphs in their blog. If you would like to have a discussion in the comments below, please take note of my Commenting policy. In a nutshell:
- Be respectful.
- Back up your claims with evidence.
Appendix: the sources and calculations of construction costs
I have used newer numbers on the costs for all but Finnish nuclear (data unchanged), and updated the capacity factor for offshore wind to 40% from the 35% Jani-Petri had used. There were some scientific publications I found about lower life-time of wind power plants as well as lower capacity factors, but after some consideration I kept the more charitable values – rather be more optimistic than pessimistic to make the fairest possible estimates.
My way of calculating the cents/kWh was far from the most efficient (my mathematician spouse simply used the numbers in the table in one equation), but I am reasonably confident in them after confirmation by said mathematician and since I reached very similar results as Jani-Petri’s.
Nuclear Korea
“In recent years the capacity factor for South Korean power reactors has averaged up to 96.5% – some of the highest figures in the world.” http://www.world-nuclear.org/information-library/country-profiles/countries-o-s/south-korea.aspx
Nuclear costs, Korea (and others): http://www.world-nuclear.org/information-library/economic-aspects/economics-of-nuclear-power.aspx
Korean reactor type: https://en.wikipedia.org/wiki/APR-1400
“The APR-1400 is an evolutionary Advanced Light Water Reactor which is based on the previous OPR-1000 design. Under Korean conditions, the reactor produced 1455 MW gross electrical power with a thermal power capacity of 3983 MW (4000 MW nominal)”
Commercial operation 2015: http://www.world-nuclear-news.org/NN-First-Korean-APR-1400-enters-commercial-operation-2012164.html
“overnight costs … $2021/kWe in South Korea” = 1723 euro/kWe (1.7 mrd/GWe)
1723 euro * (1400 MWe = 1400000 kWe) = 2.4 mrd euro
1400 MWe, 90 % cap. factor, 60 years. 8760 hours per year.
(1400 MW * 0.9) * (60 a *8760 h) = 662256000 MWh
2.4 mrd euro / 662256000 MWh = 3.6 euro/MWh = 0.0036 euro/kWh, 0.4 cents/kWh
*UPDATE: Better estimate of the cost would probably be 2330 dollars/kWe, which lands us at 1.97mrd euro/GWe. That would result in 0.42 cents/kWh, so no practical change to the table value (0.4). I’ve updated the figure while also updating with official cost statement on Finnish nuclear.
Nuclear Finland
From what I could find, the 8.5 mrd euro total cost of Olkiluoto3 was still as in Jani-Petri’s original sources, and no change in the other numbers, so this one I didn’t re-calculate.
UPDATE: 2018 TVO came out with an official calculation of price, down 3mrd euros from the earlier worst-case estimate by Areva. Final price is 5.5mrd euro. I have updated the table accordingly, price per GWe down to 3.4 from 5.3, per cent price to 0.7 cents from 1.1 euro.
“Finland’s four existing reactors (about 2700 MWe net total) are among the world’s most efficient, with an average lifetime capacity factor of over 85% and average capacity factor over the last ten years of 95%” http://www.world-nuclear.org/information-library/country-profiles/countries-a-f/finland.aspx
Lifetime of Finnish ERP expected 60 http://www.new.areva.com/EN/operations-1707/epr-reactor-economic-and-competitive.html
Many nuclear plants have outlived their expected long life-times: https://www.scientificamerican.com/article/nuclear-power-plant-aging-reactor-replacement-/
Capacity factors of nuclear: https://www.iaea.org/PRIS/WorldStatistics/ThreeYrsEnergyAvailabilityFactor.aspx
Wind on-land
European on-land wind capacity factor less than 21%
“For two decades now, the capacity factor of wind power measuring the average energy delivered has been assumed in the 30–35% range of the name plate capacity. Yet, the mean realized value for Europe over the last five years is below 21%; accordingly private cost is two-third higher and the reduction of carbon emissions is 40% less than previously expected. We document this discrepancy and offer rationalizations that emphasize the long term variations of wind speeds, the behavior of the wind power industry, political interference and the mode of finance. We conclude with the consequences of the capacity factor miscalculation and some policy recommendations.” http://www.sciencedirect.com/science/article/pii/S030142150900144X
1900 usd/kW European average 2016 World Energy Council https://www.worldenergy.org/wp-content/uploads/2017/03/WEResources_Wind_2016.pdf
1900 USD/kW to Mrd euro/GWe
1600 euro/kW * 1000000 = 1600000000 euro/GWe = 1.6 mrd euro/GWe
One wind turbine about 4.2MW (onshore or off) https://www.vestas.com/en/products/turbines/v136%20_4_2_mw
1600 euro/kW * (4.2 MWe = 4200 kWe) = 6720000 euro
1.6 mrd/Gwe, 20 years, 20% cap fact
4.2 MWe, 20 % cap. factor, 15 years. 8760 hours per year.
(4.2 MW * 0.2) * (20 a *8760 h) = 147168 MWh
6720000 euro / 147168 MWh = 45.6 euro/MWh = 0.0456 euro/kWh, about 4.6 cents/kWh
If the age would be shorter as claimed by some:
1.6 mrd/Gwe, 15 years, 20% cap fact
4.2 MWe, 20 % cap. factor, 15 years. 8760 hours per year.
(4.2 MW * 0.2) * (15 a *8760 h) = 110376 MWh
6720000 euro / 110376 MWh = 60.9 euro/MWh = 0.0609 euro/kWh, about 6.1 cents/kWh
If the cap factor was 25%:
(4.2 MW * 0.25) * (20 a *8760 h) = 183960 MWh
6720000 euro / 183960 MWh = 36.5 euro/MWh = 0.0365 euro/kWh, ab out 3.7 cents/kWh
Wind off-shore
Off-shore Danish wind 41% http://energynumbers.info/capacity-factors-at-danish-offshore-wind-farms
Capacity factor US wind, 2016 32% for 2016, 34% for 2016-2017 august https://www.eia.gov/electricity/monthly/epm_table_grapher.php?t=epmt_6_07_b
UK and Danish wind farms shorter lived than expected. “The analysis of almost 3,000 onshore wind turbines — the biggest study of its kind —warns that they will continue to generate electricity effectively for just 12 to 15 years.” …
“The decline in the output of offshore wind farms, based on a study of Danish wind farms, appears even more dramatic. The load factor for turbines built on platforms in the sea is reduced from 39 per cent to 15 per cent after 10 years.” http://www.telegraph.co.uk/news/earth/energy/windpower/9770837/Wind-farm-turbines-wear-sooner-than-expected-says-study.html Study: http://www.ref.org.uk/attachments/article/280/ref.hughes.19.12.12.pdf
One wind turbine nowadays about 5 MW
“Currently, more than 92% (10,936 MW) of all offshore wind installations are in European waters“
“Onshore investment cost assumed at USD2005 1,750/kW, and offshore at USD2005 3,900/kW.” -> Offshore 3.3 mrd euor/GWe
https://www.worldenergy.org/wp-content/uploads/2017/03/WEResources_Wind_2016.pdf
3300 euro/kW * (5 MWe = 5000 kWe) = 16500000 euro
5 MWe, 20 % cap. factor, 20 years. 8760 hours per year.
(5 MW * 0.4) * (20 a *8760 h) = 350400 MWh
16500000 euro / 350400 MWh = 47.1 euro/MWh = 0.0471 euro/kWh, about 4.7 cents/kWh
If the age would be shorter as claimed by some:
5 MWe, 20 % cap. factor, 15 years. 8760 hours per year.
(5 MW * 0.4) * (15 a *8760 h) = 262800 MWh
16500000 euro / 262800 MWh = 62.8 euro/MWh = 0.0628 euro/kWh, about 6.3 cents/kWh
German solar
German solar investment, page 41, ca 1350 e per kWp -> 1.4 mrd/GWe https://www.ise.fraunhofer.de/content/dam/ise/de/documents/publications/studies/Photovoltaics-Report.pdf
German solar farms about 100 MW
Capacity factors apprx 10-11%
https://en.wikipedia.org/wiki/Solar_power_in_Germany#Statistics
Cheaper than US solar http://www.motherjones.com/politics/2012/11/cost-going-solar-continues-drop/
Solar farm 100MW
1350 euro/kW * (100 MWe = 100 000 kWe) = 135 000 000 euro
100 MWe, 10 % cap. factor, 25 years. 8760 hours per year.
(100 MW * 0.1) * (25 a *8760 h) = 2 190 000 MWh
135000000 euro / 2 190 000 MWh = 61.6 euro/MWh = 0.0616 euro/kWh, about 6.2 cents/kWh
The Tesla battery calculation:
to get a sense of how much battery capacity this new record battery adds to the Australian grid. The capacity is given as 129 MWh. I take that to mean it can hold and return that much energy. Googling gives Australian energy usage at 10,077.84 kWh (2014) per capita, so about 10 MWh. Times 23.46 million people gives total consumption at about 235 million MWh.
So how much is 130MWh of Australia’s total consumption?
A day would be some 600 000 MWh. An hour is 27 000 MWh. A minute is still more than 400 MWh. I get 130MWh to be somewhere around 20 seconds of Australia’s total electricity consumption.


Pingback: The Right Price for Saving the Planet Depends on the Energy Form | Thoughtscapism
This is very good indeed. Here in DK our fixation on wind power will get us bankrupt.
The cost of nuclear is partly driven by regulations, and the stricter the regulations and the more dangerous we deem radiation to be, the more it drives up costs. Not only for the plant, but also for waste management, cleanup and safety. These are artificial inflated over what the evidence support, in part due to the reason below. In Japan these days the politicians has set the bar high, and that translates into unnecessary high cleanup costs and deaths in the form of unnecessary evacuations (evacuation imposes stress on the individual). In general they should have had more fact based approach, as it could have saved the estimated 800-1200 extra deaths from stress.
Another thing they forget to tell you is about how dangerous radiation is, or rather, how it is far from as dangerous as some would have us believe. Read more here, a really good source of no-nonsense information, and pay attention to the part on radiation and the LNT model. As a kid from the 80’ies, I have been astounded by the fact that only 28 died in Chernobyl from radiation and a further 15 has died from thyroid cancer. That is like less than 60 people according to the UNSCAR 2008 report. TMI has no casualties from radiation and Fukushima counts two workers with radiation burns on their legs – both recovers 100%.
http://www.hiroshimasyndrome.com/
Here a how deadly is your kWh, nuclear is the safest of the bunch and this is when the LNT model i used. The real figure for nuclear is lower.
https://www.forbes.com/sites/jamesconca/2012/06/10/energys-deathprint-a-price-always-paid/#65f0fa9d709b
So we have all been deceived. Nuclear is not as bad as the no-nukes and Greenpeace et al said. They just don’t like the fact that nuclear provides abundant power at low cost.
LikeLike
Low Pressure Safety of the Molten Salt Reactor can reduce nuclear plant cost to that of a coal fired plant Case for the Good Reactor https://spark.adobe.com/page/1nzbgqE9xtUZF/
LikeLike
Number of MSRs delivered to date? And actual costs of each? Over 80% of your presentation has nothing to do with SMR or nuclear whatsoever, only attacks on other technology. And herein lies the issue with nuclear at the present time, lots of promises, but very few current deliveries to substantiate those same promises. Our need for low-carbon generation is now, not a decade out testing a few prototypes, before another decade of scaling to rollout multiple 10s of GW per year.
LikeLike
Thank you for writing this excellent review of nuclear plant costs. I think you have taken it one step further than Partenen and Korhonen. Congratulations, and keep spreading your good word!
Richard Steeves
LikeLike
Wow, that is some high praise. Not sure I’m quite ready to own it, haha. Thanks so much!
LikeLike
Thank you for writing this, this has given me, even more, information to include in my research paper. This is one of the best articles I have read on nuclear safety and peoples blindness towards nuclear. You should really get this to as many politicians as you can, maybe then we can have clean energy.
LikeLiked by 1 person
Interesting read. In case you haven’t, I think you should take a look at Lazard’s levelized cost of electricity (updated annualy). Their latest edition is from dec 2016 (so a new version will be out soon). https://www.lazard.com/perspective/levelized-cost-of-energy-analysis-100/
It looks like your numbers underestimate how cheap wind and solar is getting.
I agree though, that nuclear has a lot of merit. solar and wind is very inefficient on a per square area occupied-basis, and as your figure shows, can be scaled much faster than solar and wind.
LikeLiked by 1 person
Thanks! Interested in reading that. Do you mean that their levelized costs are different from the levelized cost graphs I included in the end of the piece?
Levelized costs are indeed more even especially between onshore wind and nuclear. My table on construction costs is not (as I hope I pointed out clearly in the piece) the whole picture, but it is one where I have heard a lot of misleading arguments relying solely on installation cost per capacity, ignoring lifespan and capacity factors. LCOE add important factors, but they are also not the complete picture – intermittency, potential for share of energy markets, and external costs are also essential aspects to consider.
Thanks for your friendly comment and interesting reference, it’s very appreciated amongst the (unapproved) comments filled with swear words and insults 🙂
Iida/Thoughtscapism
LikeLike
LCOE should not be used to compare intermittent production with dispatchable means of production since the net real value of two systems with the same LCOE can be different. This results from neither electricity price or production being a constant.
Look, for example:
http://www.sciencedirect.com/science/article/pii/S0960148112007641
http://economics.mit.edu/files/6317
LikeLike
One important overlooked aspect of thermal power plants (nuclear, coal, gas) is excess heat “production” as a byproduct of electricity production. Utilizing this heat can result in much greater efficiency. This excess heat is a byproduct but can be intentionally produced on the expense of electricity -> for every 1MW of less electrical power, we gain 10MW of heat.
Conventional thermo (coal, nuclear, gas) power plant converts 35% of input heat (result of “burning” fuel) to electricity, the rest 65% is rejected to the environment if it’s not used. So, for every X of electrical energy, we get 2X of heat. If this heat is properly harvested (cogeneration) and used (district heating, industrial heat etc.) than there can be less electricity consumption since 60% of electricity (at least in households) is used for water heating, space heating. If this heat is provided than there is no need to convert electricity to heat.
(Sidenote: converting electricity to heat is a crime, form entropy point of view 😛 )
Such cogeneration cycles have efficiency up to 80%+ (oppose to only 35% with conventional thermo).
So how does this compare with “renewables” – solar + wind.
With solar/wind there is X electrical energy produced and some heat as a result of friction (gearbox, generator etc.) this heat is rejected to environment and cannot be harvested. So overall, we get less “usable” energy. And as a consumer, with heat demand (60% of electricity converted to heat), we convert this produced X electrical energy to heat and end up with only 40% of X produced electrical energy to do usable work (lighting, electrical appliances etc.).
It is clear that with renewables we get less of usable electrical energy. Here I mean usable energy as an energy which can be used to do work (driver a motor, charge a car battery etc.) and is not directly converted to heat (which is the lowest quality form of energy).
Every unit of heat provided is a unit of electricity saved, ofc the ratio for converting electricity to heat is not always 1:1 – think of heat pumps with ratio 1:3 (for every x unit of electricity 3x units of heat are produced). But as I wrote in the beginning for thermal power plants – for every 1MW less of electrical power, we gain 10MW of heat, so the conversion is 1:10 – ofc we can’t use it all.
We could be using a lot more of cogeneration and district heating, as of now there is about 1% of produced “useful” heat in nuclear power plants used for district heating, industrial heat and desalination – plenty of room for improvement
LikeLike
You are indeed correct about waste heat at thermal generators. Even WNA rates nuclear reactors by thermal heat MWth against MWe – in the ratios you outline. The amount of electricity that goes to heat production is however regional, for example nordic countries have a whole suite of integrated products such as heat pumps or refrigerators that “dump” rejected heat into a water tank for DHW (domestic hot water) needs, which is in stark contrast to the predominance of forced air (HVAC) systems in the US.
Another point worth noting – thermal generators (especially large units) do run up against constraints when the input cooling water temps reach 80F – whether for wildlife (fish) or efficiency of the steam cycle. It is not uncommon for large power plants in more central latitudes to reduce load (generation) during summer or when stream flows are reduced. This once-through cooling is a key consideration for the closure of Diablo Canyon NPP in the US.
Adding to this, and your point about “plenty of room for improvement” – yes indeed there is, but reality and history tells us – it is not something nuclear really cares about implementing other than as a “potential benefit” in a sales pitch. Thermal desal, industrial & district heat are not new technology developments – yet as you also mention only 1% has been realized (and honestly I think it is far less than that).
How are these two points realized in the latest deployments of nuclear reactors? Well all we need to do is look at the Barakah reactors in the UAE. Point 1 – the Persian Gulf is already heat stressed. In fact, these new reactors needed to be down rated in their designs (the MWth to MWe is worse than the average). There are no indications that the PG temperature will decrease, but we can be assured its temperature will rise. How fast is a determination by scientists, but I have a sneaking suspicion even the downrated plant will not be able to operate at full capacity for more than 30 years. Point 2 – the UAE burns natural gas to desalinate water – yet this state of the art (cost & on-schedule) NPP has no thermal desal component that would only help against the cooling water heat stress it is against.
Counting on nuclear to do anything more than “boil water” to generate electricity is, unfortunately, the best we will ever see out of the industry.
LikeLike
Just a couple of notes. The Hornsdale Tesla battery isn’t the world’s largest, that title is currently held by a vanadium redox installation in China https://twitter.com/vsunptyltd/status/935037271228661760
Also, it rarely occurs to commentators to assess what the combined lifecycle emissions may be when storage is added. The best estimate I can find for wind+LiION is 110 gCO₂e/kWh https://twitter.com/OskaArcher/status/934636267278438400
LikeLiked by 1 person
The temporal dimension should also be considered. The learning rate for PV price has been 24% for the last 35 years, along with an almost comparable learning rate for efficiency versus installed capacity.
Since building vast amounts of new generating capacity takes time, this will make solar a better option than presented here. Especially as AFAIK nuclear has a negative learning rate.
Also solar in other parts of the world than Central Europe can have capacity rates of 15 to even 30%.
And further, the life time of a quality solar PV system is probably at least 40 years. The only reason that 25 years is currently being used in literature is that it matches the most common warranties. But in reality degradation rates are around 0,5% per year under average circumstances, so even after 40 years we should except around 80% performance from a plant.
LikeLike
Interesting article. You make a good point about weighing health / environmental risks, but I think it is worth focusing on the red under “nuclear accidents” in that graph. I don’t feel like “accident” properly represents the issue, like it is something that happens once and is done. I live in Japan just outside of Tokyo, and I pay my electric bill to TEPCO every month. Although developments in nuclear (and robotics etc.) will hopefully sort these risks out and see through to the end, the end is a long long time. Cleaning up the mess, which we hope is possible, ” is estimated to take 30 to 40 years and cost upwards of $188bn (£142bn).” (Quote from this article: http://www.ibtimes.co.uk/melted-uranium-core-finally-discovered-fukushima-nuclear-plant-clean-take-40-years-1648165). So, on the graph, that little flick of red looks small…but for people who live near accidents, the impact is very real. And when considering risk management, this isn’t a light issue. I’m not ruling out nuclear, but I’m happy to wait and see how Fukushima pans out before we build one in everyone’s back yard.
LikeLike
Thanks for your interest in my blog, iloverocks!
I understand that living close to a place where a nuclear accident has happened can leave a very powerful impression of threat. Luckily however, the radiation did not cause, and isn’t expected to cause, any mortalities, even among the emergency workers. Of course if an energy form results in an accident, it is always tragic. I find it even more tragic, however, that we have many energy forms that result in heavy casualties even when they go right (referring here to the millions of deaths from air pollution every year).
The peculiar thing is that quite often when I present as all-encompassing evaluations about energy sources as possible, many readers will dismiss them, not really believing that their specific concerns are truly included in those assessments. In your case, in the data about all external impacts of energy sources, it appears you can’t quite believe that evaluations of all effects, both risks and the life cycle burdens of different energy forms, truly take the impacts of nuclear accidents into account – you seem to imply that nuclear accidents, after all, are more expensive, and that all the other ill effects reported by the chart are in fact not as costly as they say they are. I hope you see the problem in dismissing the external costs from all other energy forms and concentrating only on the costs of nuclear as above and beyond anything else, even to the point that comparisons would not need to be made.
Any accident is harder in the way that it puts more of the cost on one area specifically. But that is not so far from many of the other impacts taken into account in the chart – mining operations, for instance, destroy and severely pollute local large areas. Should we, say, halt the building of all renewable energy sources until we see if and at what cost the area of lake Baotou (location of a waste-lake from rare earths mining, contaminated with both radiation and heavy metals) can ever be cleaned up?
To clean up the Fukushima plant is a long and costly process, but if we want to avoid more expensive, long-lasting environmental harm, we have to look at where the evidence points to in choosing the energy forms that lead to least amounts of additional harm. We are heuristically wired to pay more attention to a large threatening event, and easily ignore the constant, tragic kinds of pollution impacting us a little bit every day. On the other hand, we also pay much less attention to large accidents when they are, say, explosions or fires at coal plants, or dam breakages, which have happened a great number of times, causing both considerable health harm and economical damage. That grave nuclear accidents have happened twice in the history of mankind, still it somehow gives us the impression that this kind of risk is much larger. If we rely only on these impressions, unfortunately, we end up causing more harm to human health and the environment.
While the cleanup of Fukushima plant itself is important, the cleanup of the area all around it is questionable. The IBT piece links to ‘removal of uranium’ which brings you to another piece by them, where they make headlines about cesium leaching into sea water. Note they make no attempts to actually put the amounts or risk into context. This is a big part of the problem. Where even trace amounts are measurable, the mere detection can make threatening headlines, and people will believe in harm where no evidence of actual harm even exists.
Different areas in the world naturally have quite variable levels of radiation, and Japan is one with markedly little background. The area around Fukushima did reach a somewhat higher level after the accident, and AFAIK, the Japanese government has intended to ‘clean it up to previous levels’. This might seem logical. But let’s say an area suffered from a big fire. Should we, after the fire was done, engage in cleanup projects until no signs of the fire could be detectable – say, no particles of ash could even be found?
It makes sense to take action where the environment or humans would suffer ill effects. But the lowest level of observed health effects from radiation start at about 100 mSv per year. The average background in the Fukushima area now is a couple of mSv per year. If an area with that kind of background radiation per year warrants an expensive clean-up project, then we won’t get away cheap. Because nature has arranged it so that very large areas, home to millions of people, are way above this limit. It’s similar to the national average natural radiation levels in Finland (where I’m from), and a lot less than is found around Finland’s third largest city Tampere (the area where my ancestors come from) and a lot of places in the alps (where I now live, in Switzerland): up to or even above 10 mSv. You can find a lot more info on the naturally occurring radioactive materials, and also a colour-coded map of Europe here: http://www.world-nuclear.org/information-library/safety-and-security/radiation-and-health/naturally-occurring-radioactive-materials-norm.aspx
Stirring up fear about this kind of background level, and demanding it to be cleaned up, is both illogical and unethical. Fear of radiation caused evacuations that were not necessary, and will continue to cause resources to be wasted on something that would never cause harm.
If you are interested in reading more about this, you might want to read a piece where I analysed my similar stance before – that impacts of nuclear accidents simply had to be more devastating and problematic than any other energy form, and that I did not need to compare them to other forms because they were in a class of their own: https://thoughtscapism.com/2017/11/04/nuclear-waste-ideas-vs-reality/
I’d also warmly recommend this piece by a fellow Finn, about comparisons between Fukushima area and Finland, in connection to Greenpeace’s misleading reporting of the topic: https://jmkorhonen.net/2017/02/22/hey-greenpeace-could-you-find-us-finns-a-warm-place-to-live-in/
Here’s a paper looking at the radiation around number of schools inside Fukushima, outside, and in Europe. The highest results come from Europe, and the Fukushima schools are on par with elsewhere in Japan: http://iopscience.iop.org/article/10.1088/0952-4746/36/1/49/meta
There are also good pieces on the real and serious effects of fear – by imagining threats we risk creating ones that have real impacts. Risk consultant David Ropeik: https://aeon.co/ideas/fear-of-radiation-is-more-dangerous-than-radiation-itself
and by NYTimes here: https://mobile.nytimes.com/2015/09/22/science/when-radiation-isnt-the-real-risk.html?_r=1
More about the cesium in sea water, and a great piece overall on many Fukushima myths here, by Popular Mechanics: http://www.popularmechanics.com/science/energy/a19871/fukushima-five-years-later/
I understand your wariness, but I also ask you to please think about applying that caution to all the energy forms – they all carry risk, many also the risks of large accidents. There is one among them that causes most harm – real, expensive, and life-threatening harm: fossil fuels. We should do all we can to move away from that and to the other, order of magnitude safer energy forms. Nuclear is an important part of that shift.
Thanks for reading.
Best regards,
Iida/Thoughtscapism
LikeLike
Dear Thoughtscapism,
Thank you for your thorough reply. I apologize to have been away for here for so long as I have only just now read it. I agree with the many points you have expressed, and especially I agree that moving away from other damaging forms of energy production is desired. Thank you for the research and links; I intend to have a look, and I am always grateful for different perspectives as they increase my learning opportunities. Thank you for giving my concerns your attention. Like you mention, many people have irrational fear of radiation, and lack the knowledge of its presence in everyday life at harmless levels. The Fukushima clean-up project is fascinating indeed, and there is much to learn. Right now – regarding ‘disposal’ of some of the already treated waste – it seems the most feasible option is release into the ocean and dilution. I understand the reasoning behind this, as diluted levels of radiation are not significantly harmful. It may be the best solution for everyone. However, these decisions have become highly political and international. While I hope to see progress in the development of radioactive waste treatment, I can understand the desire for caution when dealing with something that breaks down slowly, and dilution is the only option in the short-term.
Whereas I have hope that we can learn more, and nuclear plants might become good alternatives (you make many good arguments)… I think a lot can be said about being frugal with energy in general. After the incident here in Japan, I learned that tremendous amounts of energy can be saved with just small changes in policy and in our individual lifestyles. As you said, fossil fuels are also very damaging to our environment. No form of extracting energy comes without a trade-off (and I do see the merit in comparing and finding the best way). Yet learning about the right solutions takes time, and I believe, if we can help it, it shouldn’t be rushed….(just the amount of time to have this conversation and pour over these facts is intensely time consuming). Thus, keeping consumption in check is important because it takes us time to learn and progress. For me, if a decline in consumption patterns could put off new plants from being built, and we utilize more from what we already have, that is a win from my perspective.
LikeLike
Pingback: Off the Press: Nuclear Energy Is a Fast and Inexpensive Way to Improve the World | Thoughtscapism
Pingback: Saving Lives Is Not Shameful – Let’s Break the Stigma on Supporting Nuclear Energy | Thoughtscapism
Pingback: Leben und Natur retten: Wider die Stigmatisierung von pro-Kernenergie | gwup | die skeptiker
Pingback: Nuclear is a Crucial Piece of the Carbon-Free Puzzle | Thoughtscapism
You are an amazing person. Thank you! And keep it coming!
LikeLike