Perhaps you’ve heard that the moon day is very hot (past boiling point) and the moon night is really cold (about 150-200 C below freezing, or more than twice as cold as ever measured on Earth – Antarctica -83 C). Have you ever wondered why? We’re both just as far from the sun. So what accounts for the difference?
The answer is: the atmosphere and the greenhouse effect. Let’s take a quick look at how that works.

Infographic summary of this post. Materials from the course Making sense of climate denial
While the full range of solar radiation hits us, most of it is absorbed and turned into heat. The warm surfaces then radiate this heat – they give off radiation in the infrared spectrum. But here’s the crux. The molecules in the atmosphere that didn’t much hinder the passage of visible light before now become a veritable wall for the outward escaping rays of the infrared spectrum – they meet the greenhouse gases. These gases, such as carbon dioxide and methane, readily absorb the infrared radiation. They will then re-emit much of that heat once more (in all directions, no longer only outward), only for it to be reabsorbed by the neighbouring greenhouse gas molecules and so on. A significant portion of the heat becomes effectively trapped in this absorption limbo, and the rate at which the heat can escape into space slows down. This all means that thanks to greenhouse gases, we get to keep more of that heat.
Ben Santer, who was the convening Lead Author of Chapter 8 of the year 1995 IPCC Report, elaborates on how this manner of warming has distinctive characteristics quite different from what we would expect for warming derived from increased radiation from the Sun, for instance. This excerpt is from an interview with him, included in the online course Making sense of climate denial:
There’s a common myth that global warming is caused by the Sun rather than humans. That myth fails to account for the available evidence. If the Sun were responsible, we would see an entirely different pattern of global warming. In that scenario, we would expect to see the Earth warming most when sunlight is bombarding the surface the most – during the daytime, and during the summer season. That means that if the Sun were responsible, we would see days warming faster than nights, and summers warming faster than winters.
So when the increased capacity to retain heat in the atmosphere is to blame for the change in temperature, then the trend of warming will become even more noticeable during the times when the suns rays are not present – the time when we are dependent on the heat stored in the atmosphere.
What is it then that we see in the data? It demonstrates quite clearly that winters are warming faster than summers.
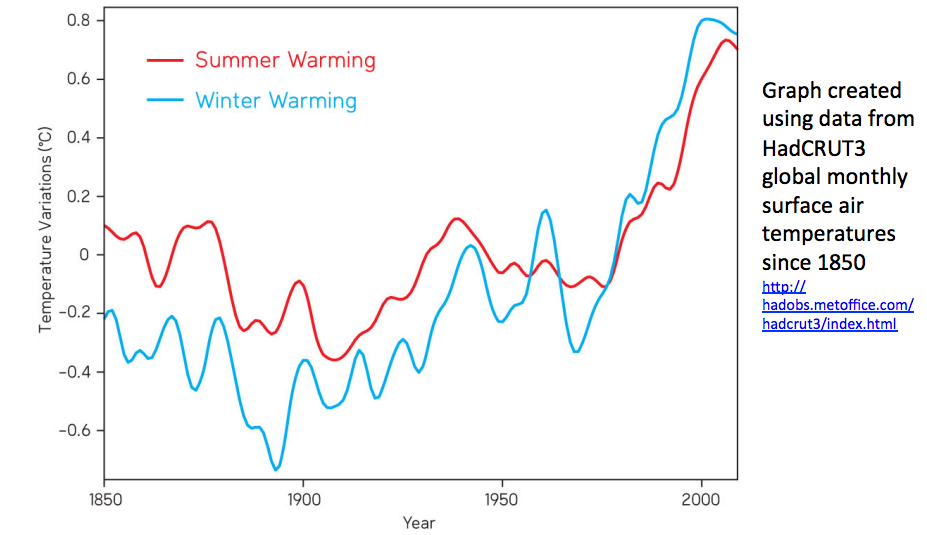
Graph by Dana Nutticelli from a lecture at Making sense of climate denial. You can find the data from HadCRUT3 here
And the nights are warming faster than the days.

This graph was provided in a lecture by Dana Nutticelli as a part of the course Making sense of climate denial. You can find the referenced paper Global observed changes in daily climate extremes of temperature and precipitation here.
When you look at the patterns of intensity in the solar radiation and earth temperatures side by side, since the 1960’s they also shows a trend of a slightly cooling sun while the earth is warming. It all points to the heat-trapping effect of the greenhouse gases.

For the sources of this data please see Skeptical Science
These phenomenon of faster night and winter-time warming are just two examples among the 10 or so specific characteristics which scientists use to determine the cause of the current warming of the climate. They are also known as the human fingerprints in global warming. Here they are:
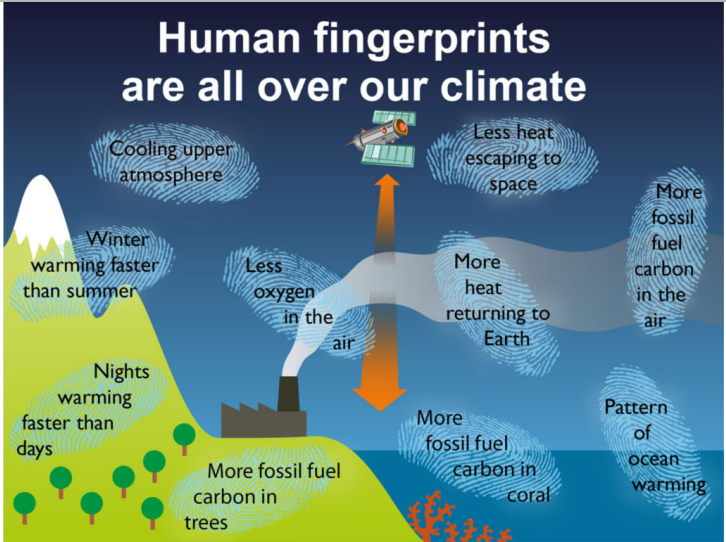
For more information on human fingerprints, you can see Wikipedia Attribution of recent climate change or Skeptical Science
I will do my best to continue to present some of the central concepts of the above fingerprints as well as the core themes on the topic of climate change, but if you want to know more, please visit the resources I have collected on my Climate and Energy page, or join us at the massive open online course.
EDIT: For those who wish to know more about the graphs presented in the infographic, or read more in-depth about how global temperature records are built and evaluated, there is a wealth of research on the topic. The statistical confidence of the temperature record is an important topic and I certainly encourage everyone to read more to gain an appreciation of the immense amount of work and scientific analyses that have gone to evaluating the reliability of temperature records.
More on uncertainties in the data-set used for the Winter-Summer graph found over at Met Office Hadley Centre observations datasets -website. (also referenced in directly under the graph)
From there you can read for instance that:
Brohan et al. 2006 answer the concern that observations are too unreliable to estimate a global average. Brohan et al. explicitly calculate uncertainties on the global average surface temperature anomaly, which, although larger in the early period than the modern, are far smaller than is often supposed. The fact that the uncertainties are small arises, in part, from the fact that temperature anomalies are correlated over large distances. This means that the global average temperature anomaly can be assessed with a relatively small number of widely separated stations.
and:
Because there is no correct method of estimating the global average temperature from the sometimes sparse observations, the differences between the analyses can be thought of as an additional uncertainty that would be impossible to assess if only a single global temperature analysis existed. Vose et al. 2005 (An intercomparison of trends in surface air temperature analyses at the global, hemispheric, and grid-box scale, GRL) showed that the largest differences between the land surface air temperature data sets arose from the way that the gridded data were averaged to obtain a global value. For data sets which combine land and ocean data there are additional uncertainties, for example how to estimate temperature anomalies over the polar regions. Despite the differences in approach, the average correlation between the three major global temperature data sets is greater than 0.98.
The Night-Day graph on the other hand is based on the paper Global observed changes in daily climate extremes of temperature and precipitation (also referenced under the graph) They conclude:
[52] 1. Between 1951 and 2003, over 70% of the land area sampled showed a significant increase in the annual occurrence of warm nights while the occurrence of cold nights showed a similar proportion of significant decrease. For the majority of the other temperature indices, over 20% of the land area sampled exhibits a statistically significant change and all but one is field significant.
[53] 2. Using a fixed set of complete grid boxes, we find that all indices exhibit a significant change between 1951–1978 and 1979–2003. Warming is apparent in all seasons although March to May generally exhibits the largest change and September to November the smallest change. Over nearly all parts of the globe both tails of the minimum temperature distribution have warmed at a similar rate. Maximum temperature extremes have also increased but to a lesser degree.
For more reading:
BUILDING A ROBUST TEMPERATURE RECORD
Morice, C. P., Kennedy, J. J., Rayner, N. A., & Jones, P. D. (2012). Quantifying uncertainties in global and regional temperature change using an ensemble of observational estimates: The HadCRUT4 data set. Journal of Geophysical Research: Atmospheres (1984–2012), 117(D8). Link to paper
Rohde, R., Muller, R., Jacobsen, R., Perlmutter, S., Rosenfeld, A., Wurtele, J., … & Mosher, S. (2013). Berkeley earth temperature averaging process. Geoinfor. Geostat.: An Overview, 1(2), 1-13. Link to PDF
Cowtan, K., & Way, R. G. (2014). Coverage bias in the HadCRUT4 temperature series and its impact on recent temperature trends. Quarterly Journal of the Royal Meteorological Society, 140(683), 1935-1944. Link to paper
Smith, T. M., Reynolds, R. W., Peterson, T. C., & Lawrimore, J. (2008). Improvements to NOAA’s historical merged land-ocean surface temperature analysis (1880-2006). Journal of Climate, 21(10), 2283-2296. Link to PDF
Hansen, J., Ruedy, R., Sato, M., & Lo, K. (2010). Global surface temperature change. Reviews of Geophysics, 48(4).Link to paper
Compo, G. P., Whitaker, J. S., Sardeshmukh, P. D., Matsui, N., Allan, R. J., Yin, X., … & Worley, S. J. (2011). The twentieth century reanalysis project. Quarterly Journal of the Royal Meteorological Society, 137(654), 1-28. Link to paper
Mears, C. A., & Wentz, F. J. (2009). Construction of the Remote Sensing Systems V3. 2 atmospheric temperature records from the MSU and AMSU microwave sounders. Journal of Atmospheric and Oceanic Technology, 26(6), 1040-1056. Link to PDF
Spencer, R. W., Christy, J. R., Braswell, W. D., & Norris, W. B. (2006). Estimation of tropospheric temperature trends from MSU channels 2 and 4. Journal of Atmospheric and Oceanic Technology, 23(3), 417-423. Link to paper
Anderson, D. M., Mauk, E. M., Wahl, E. R., Morrill, C., Wagner, A. J., Easterling, D., & Rutishauser, T. (2013). Global warming in an independent record of the past 130 years. Geophysical Research Letters, 40(1), 189-193.Link to paper
Ahmed, M., Anchukaitis, K., Buckley, B. M., Braida, M., Borgaonkar, H. P., Asrat, A., … & Phipps, S. J. (2013). Continental-Scale Temperature Variability during the Past Two Millennia: Supplementary Information. Nature Geoscience, 6(5). Link to PDF